Natural disasters, including the recent floods in Nepal and wildfires in Europe, have raised awareness about the impacts of climate change. According to the Intergovernmental Panel on Climate Change (IPCC), “human activities, principally through emissions of greenhouse gases, have unequivocally caused global warming”, which is increasing the risks of extreme weather events. The Paris Agreement, adopted in 2015, set a global goal to limit this warming to well below 2°C and pursue efforts to keep it below 1.5°C.A decade later, measuring carbon emissions helps us understand the efforts taken by nations towards a clean energy transition. They tell the story of how the energy landscape has been transforming, yet how emissions remain at record highs. According to the 2025 Global Carbon Budget, global fossil-fuel CO₂ emissions are expected to reach a record high of approximately 38.1 billion tonnes in 2025. That’s an enormous amount of carbon dioxide entering the atmosphere in just one year, largely from burning coal, oil and natural gas.But which countries are contributing the most? And where does India, one of the world’s fastest-growing major economies, feature on this list?
The world’s 10 biggest carbon emitters
The following ranking focuses on annual fossil-fuel and industrial CO₂ emissions in 2024, the latest consolidated country-level data presented in the Global Carbon Budget 2025. These figures do not include all greenhouse gases or emissions from land-use change.
China – 31.8%
China has topped the list, accounting for nearly one-third of global fossil CO₂ emissions. Being a major industrialised economy, its enormous manufacturing industry, coal-powered electricity generation, steel production and construction sector all contribute to its carbon footprint. From producing electronics and machinery to building cities at breathtaking speed, China’s industries consume huge amounts of energy.
United States – 12.7%
The United States contributes roughly one-eighth of global fossil CO₂ emissions. Its car-focused lifestyle, extensive road networks, aviation and industrial capacity are responsible for this huge contribution. Moreover, oil and natural gas remain major contributors.
India – 8.3%
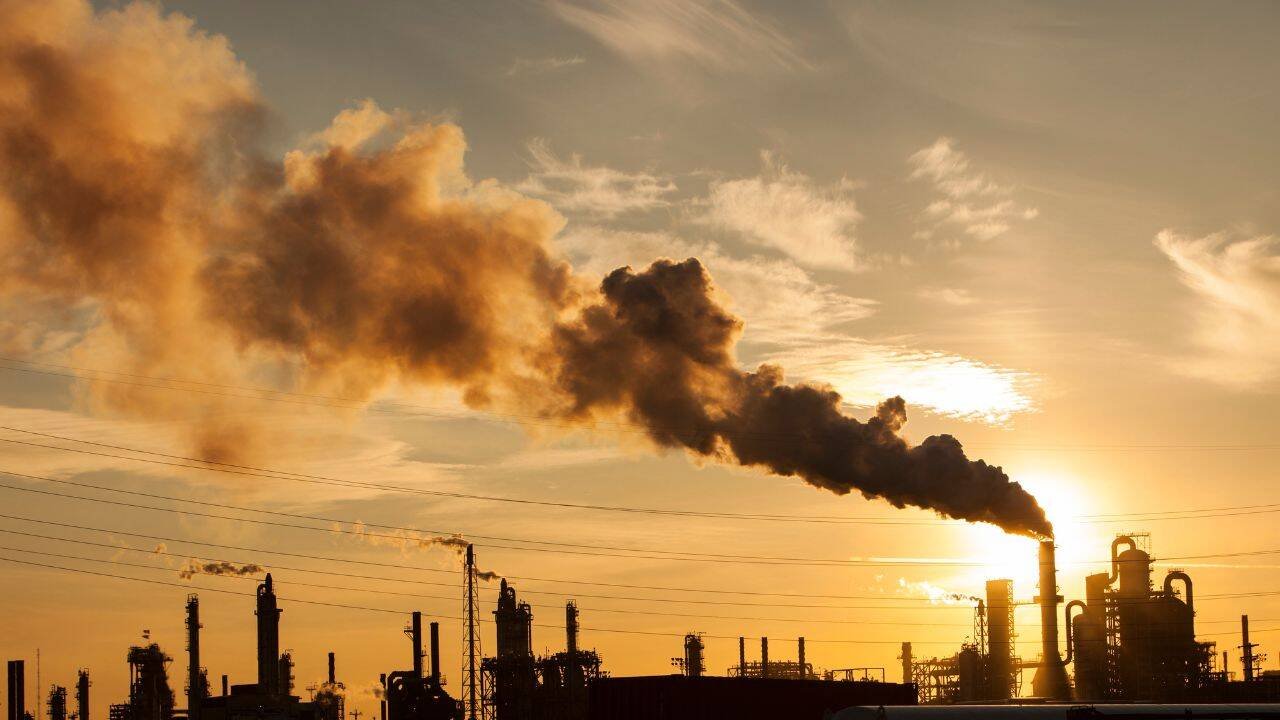
India contributes around 8.3% of global fossil CO₂ emissions. With a population exceeding 1.4 billion, growing cities and expanding industries, there is increasing demand for electricity. While there has been an increase in energy from non-fossil fuel sources, coal remains a major part of the energy mix.
(Image Credit: Canva)
Russia – 4.6%
Russia’s large oil and gas industry, along with its other energy-intensive industries, contributes significantly to its emissions. Industrial production, power generation and domestic heating, particularly because of its extremely cold climate, add to its carbon footprint.
Japan – 2.5%
Japan’s position reflects its advanced industrial economy, manufacturing sector and considerable energy requirements. Cars, electronics, steel and chemical production all require energy.
Indonesia – 2.1%
Indonesia’s emissions are driven by coal-powered electricity, industrial expansion and energy demand from its growing population. Indonesia is an island nation where its carbon footprint is also significantly influenced by land-use change and deforestation. These land-related emissions are counted separately from the fossil-fuel ranking discussed here.
Iran – 2.0%
Iran’s large oil and natural gas industry is a major source of its carbon emissions. Domestic energy consumption, power generation and industrial activity add to the numbers. Its substantial fossil-fuel resources make transitioning towards cleaner energy a particularly important challenge.
Saudi Arabia – 1.8%
Saudi Arabia is one of the world’s largest oil-producing nations. Along with emissions from the production and consumption of oil, other energy-intensive activities, including air conditioning and desalination, contribute significantly to the country’s carbon footprint. These activities are particularly important given its desert climate.
South Korea – 1.5%
South Korea may be relatively small geographically, but its industrial footprint is considerable. With the majority of its industries operating in sectors such as electronics, shipbuilding, automobiles, steel and petrochemicals, the country requires substantial amounts of energy. Its continued reliance on fossil fuels, particularly coal and natural gas, makes decarbonising its industrial sector a major priority.
Germany – approximately 1.5%
Germany is an industrial nation with significant contributions to global supply chains for major industrial goods. Its enormous automotive industry and electricity generation are major contributors to its carbon footprint.
Where does India really stand?
Though India remains among the top three carbon emitters, its per-capita contributions remain considerably lower than those of other countries on the list.According to the Global Carbon Budget 2025, India’s fossil CO₂ emissions per capita in 2024 were approximately 2.2 tonnes. Compare that with around 8.7 tonnes in China and 14.2 tonnes in the United States. In other words, India’s overall emissions are high partly because of its enormous population, but the average Indian’s carbon footprint remains considerably lower than that of people in these two countries.Moreover, India’s fossil CO₂ emissions increased by 4% in 2024, the fastest growth among the four largest emitting countries in that year’s Global Carbon Budget assessment. For 2025, the report projects a further 1.1% increase. The challenge is balancing economic development with environmental responsibility. Millions of people still need better access to electricity, transport, housing and other essentials.
Ten years of the Paris Agreement: Has the world kept its promises?

Paris Climate Agreement (Image Credit: Canva)
The Paris Agreement was a landmark moment in international climate diplomacy. The agreement was adopted on December 12, 2015, and entered into force on November 4, 2016. It provides a flexible approach, allowing each country to decide its own climate goals. This happens through the mechanism of Nationally Determined Contributions (NDCs), which countries are required to submit and update every five years.Though there is increasing investment in renewable energy across several major economies, rising energy demand continues to offset much of this progress. The Global Carbon Budget 2025 estimates that coal accounted for approximately 41% of global fossil CO₂ emissions in 2024. This was followed by oil at 32% and natural gas at 21%. This reflects that, despite the growing availability of renewable energy, the world is still heavily dependent on fossil fuels.